The haze conditions have been bad and getting worse in Malaysia and Singapore the last few weeks. Not since the extremely bad haze in 2013 have things been so bad.

Map of haze over Singapore and Malaysia for October 18th via the ASEAN Specialised Meteorological Centre.
Once again the main culprit is burning of forests in Indonesia. The map shows the darkest haze over the sources of the fires in Indonesia In the last week Melacca, Sengalor and even parts of Sarawak have had even worse pollution than Johor Bahru.
From the Department of Environment of Malaysia which publishes API* readings hourly for 4 sites in Johor (as well as the rest of Malaysia). A reading above 100 is unhealthy, above 300 is hazardous. In Malaysia this week readings have been above 150 several times and above 100 quite often.

Charts of Singapore haze readings, October 2015, via the the Singapore National Environment Agency.
The situation is expected to continue until the rainy season puts out the fires in January. There is firefighting ongoing but it is not able to put much of a dent in the massive outbreak of polluting fires.

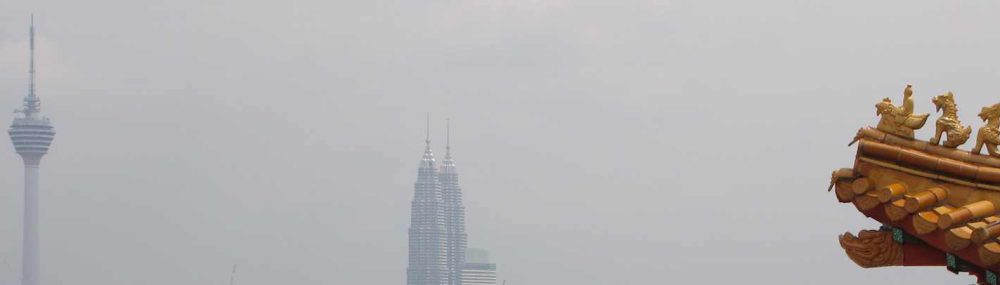
Photo of haze over Johor Bahru, 20 June 2013, when the pollution was even worse than today.

Photo of the same scene without hazy conditions, buildings in Singapore are visible in the background.
Haze crisis could persist into new year, say experts
The Ministry of Environment and Forestry yesterday said it was still investigating the cause of the fires in Papua. But its director-general of law enforcement, Mr Rasio Ridho Sani, said this year’s fires have reached an unprecedented level.
…
The smouldering haze from the fires has spread across many parts of Indonesia, Singapore, Malaysia, Thailand and the Philippines.
Related: Air Pollution Returns to Singapore and Johor (2014) – Tanjung Piai National Park (the Southernmost Point in Asia) – Rainbow Over Johor Bahru
* Notes
* = Fine particles (PM10) c = Ozone (O3)
a = Sulfur Dioxide (SO2) d = Carbon Monoxide (CO)
b = Nitrogen Dioxide (NO2) & = More than one pollutant
API calculations
API value is calculated based on the average daily concentrations of air pollutants SO2, NO2, CO, O3 and PM10. The dominant air pollutant with the highest concentration recognized as pollutants that will determine the value of the IPU. Normally, concentration of fine dust (PM10) is the highest compared to the pollutant others and this determines the API readings.
Indonesia’s fires are emitting more greenhouse gases every day than the entire USA
So far this year, Indonesia’s fires have produced more pollution than Germany does in a year. On 26 days from the period of Sept. 1 to Oct. 14, their daily emissions surpassed those of the entire US (the world’s second-largest emitter of greenhouse gases after China), according to researchers led by Guido van der Werf from VU University Amsterdam. They calculated that the nearly 100,000 fires in Indonesia detected to date this year emitted more than 1,000 metric tons (1,102 tons) of carbon dioxide equivalent emissions cumulatively. That puts the country on track for its worst fire year since 2006. On Oct. 14 alone there were more than 4,700 fire alerts—that’s more than on any single day in the past two years.
…
Tropical peatland fires are not like regular forest fires. They generate enormous amounts of smoke and are fiendishly difficult to extinguish. Draining and burning these lands for agricultural expansion leads to huge spikes in greenhouse gas emissions.